On February 8, 2026, the U.S. Department of Health and Human Services published the largest open-source Medicaid claims dataset1 in the program's history: 227 million billing records2, $1.09 trillion in total payments, and 837,611 unique providers3, spanning 2018-2024. Within that dataset, numerous findings warrant attention, but one billing pattern towers above every other: New York State's billing under procedure code T1019, Personal Care Services. New York’s Medicaid personal care billing isn’t just high — it’s statistically concerning.
When the Alaffia team first looked at the HHS dataset, it showed us a $123 billion billing code that, on its own, would rank as one of the largest line items in American healthcare. And when we mapped where that money was going, one state accounted for 61% of it. New York, and specifically, a cluster of home health care agencies concentrated in Brooklyn and Queens, was billing Medicaid for personal care services at a scale that appeared to have no legitimate clinical explanation.
For context, personal care and home health services are straightforward: an aide helps an elderly or disabled person with basic activities like bathing, dressing, and eating. The work is real, and the need for services is genuine, but it is, by design, one of the hardest categories in Medicaid to audit. The billing is done in 15-minute units, in private homes, with no independent verification, against a population that is often too vulnerable to dispute what's being submitted on their behalf.
Based on our assessment of the dataset, it appears that numerous home health providers are exploiting these billing verification gaps.
The numbers that follow are not projections or models: they come directly from the federal government's own claims data, after years of this spending occurring largely in the dark. They show that New York's top personal care providers are billing for beneficiary populations that, by any reasonable measure, may not exist. They show that providers are being paid more per claim than the average of all 48 other states and Washington, D.C.4, while simultaneously billing for many more unique patients than the average of all other states. And they show that 88 of the 98 largest T1019 billers in the entire country are based in New York alone.
So what exactly is T1019?
Healthcare Common Procedure Coding System (HCPCS) code T1019 is a standardized medical billing code used primarily by state Medicaid agencies to reimburse caregiver agencies for personal care services performed by non-clinical personnel. These services consist of non-skilled assistance provided to individuals, often elderly or disabled, in their homes to help with activities of daily living, such as bathing, dressing, meal preparation, and more. The procedure code is also billed in 15-minute increments, so one hour of services would result in four units of charge to Medicaid.
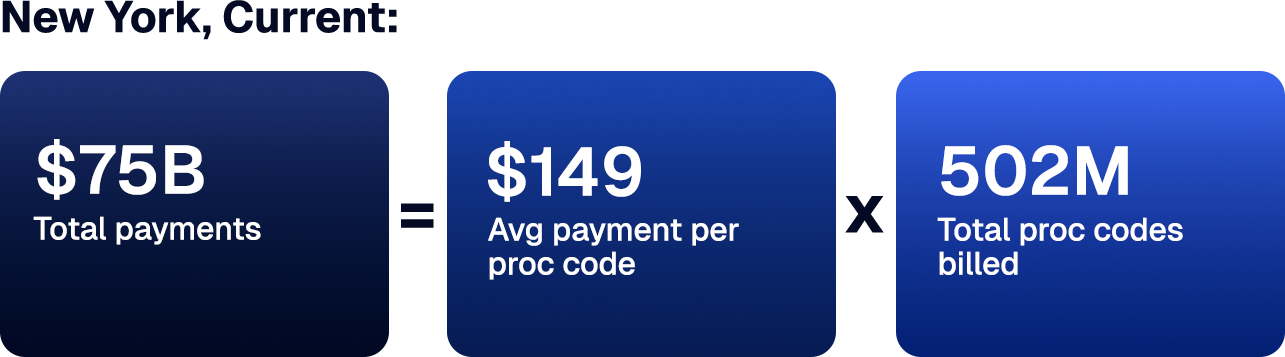
In the HHS data set, T1019 represents $123 billion in national spend over the dataset period, and New York alone accounted for 61% of that spend, or $75 billion. The second-highest paid state, Massachusetts, accounts for $8.4 billion.
This gap is not explained by Medicaid enrollment. In January 2024, New York had approximately 7.1M Medicaid and CHIP enrollees, compared to 1.7M in Massachusetts — about a 4x difference in enrollees. If T1019 spending scaled proportionally with enrollment, we would expect New York’s T1019 payments to be roughly 4x that of Massachusetts. Instead, New York’s T1019 payments were 8.8x higher, nearly double what would be expected based on enrollment.
A more plausible explanation for the gap? A structurally compromised billing environment that Medicaid’s rule-based audit systems are not designed to detect.
The National Picture: New York Is the Clear Anomaly
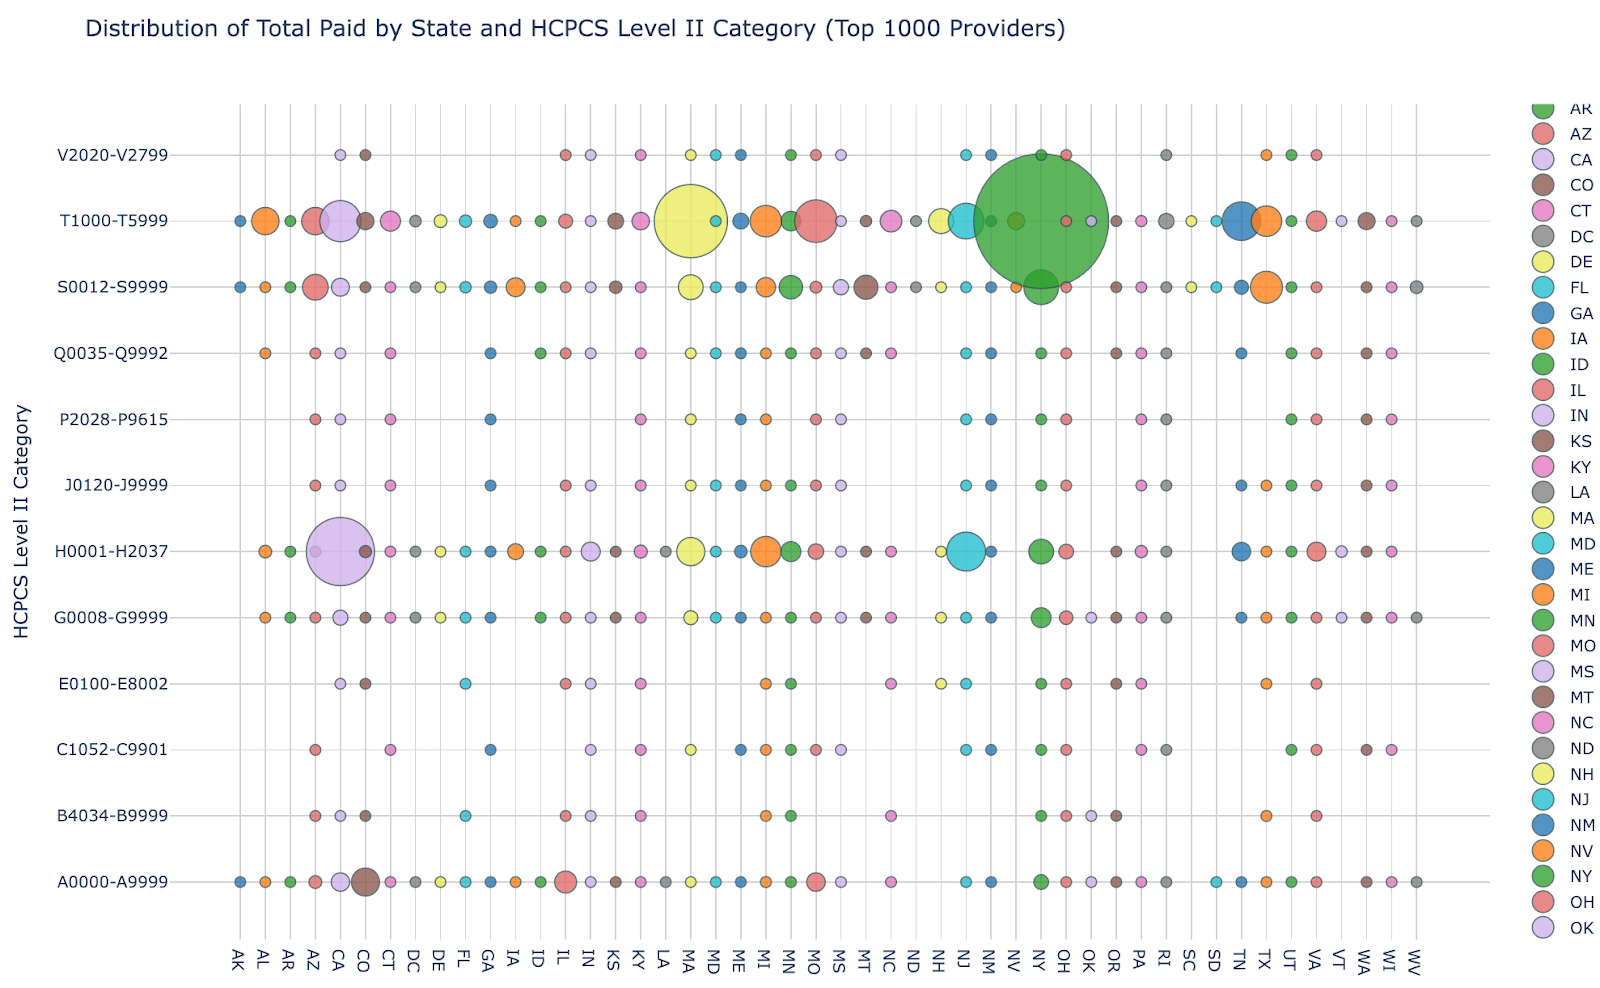
While New York’s share of T1019 payments compared to Massachusetts is compelling on its own, the trend becomes even more apparent when compared to the other states. The chart below maps total Medicaid spend by state against HCPCS code categories (Level II only), with each dot representing a state-code combination. In the T1000-T5999 row, which contains T1019, New York’s concentration in this data set generates a bubble so large it is not meaningfully comparable to any other. New York's personal care spending does not sit at the far end of a distribution — it occupies a separate category.
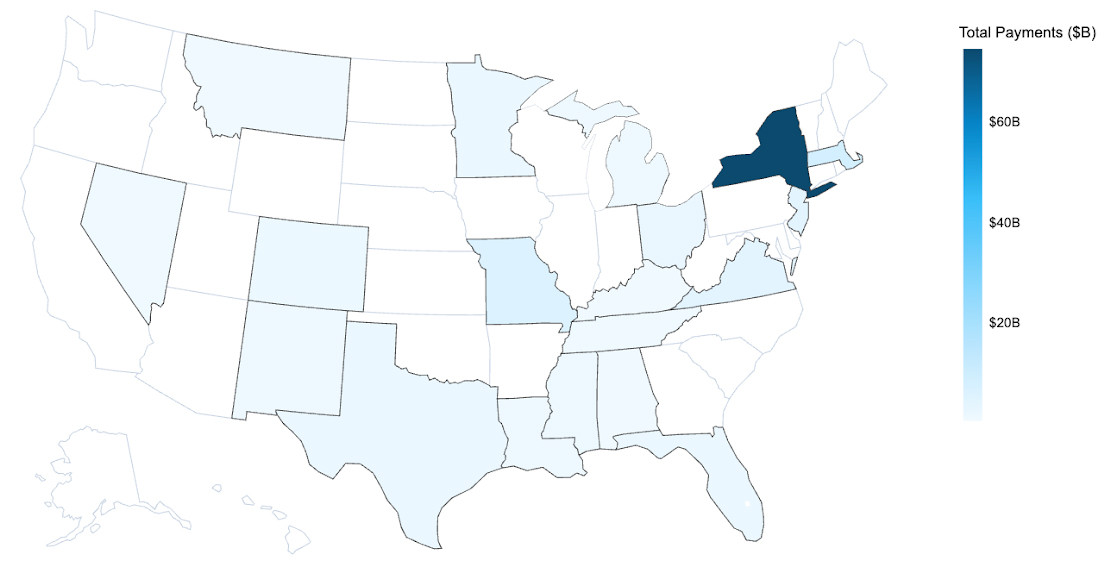
The geographical heat map below further highlights the anomalous T1019 Medicaid spend across 50 states and DC. The darker the shaded blue region, the more spending is attributed to that state from 2018-2024. As is immediately evident visually, New York State represents a disproportionate share of spend (61% of total attribution) compared to all other states.
Geographic Payments Distribution for Billing Code T1019
The FWA is Primarily Taking Place in Brooklyn and Queens
New York state is clearly a national outlier for Medicaid payments, but where is the T1019 spend primarily taking place? New York City, as you might have guessed, with an overwhelming incidence occurring in Brooklyn and Queens. Providers in those two boroughs alone received $50B, or 81%, of the total Medicaid payments in NYC ($61.4B), 67% of the payments in the state, and a whopping 41% of the payments across the country.
T1019 Spending Across NYC Boroughs & Other NY
From 2018-2024, the top ten providers in New York received a combined $15B, with the top provider, based in New Hyde Park, receiving $3B. These ten providers alone received nearly 12% of the $123B that was paid by Medicaid for T1019 from 2018-2024.
That's $15 billion in payments and 12% of all national T1019 spend across just 10 providers. The question isn't whether these numbers are anomalous: they clearly are. The question is, what billing behavior produces them, and how are these providers receiving such staggering payouts?
Common Fraud, Waste, and Abuse Patterns Associated With Personal Care Billing
Below are a few common, high-risk schemes that, based on our experience, are used by personal care service providers to maximize their Medicaid reimbursement. These are not hypothetical fraud scenarios: they are documented patterns that federal prosecutors have previously charged against T1019 providers.
While less common than other schemes, phantom visits are still frequently used by personal care service agencies that commit fraud. Take the trend we see when analyzing the number of unique beneficiaries who received care during the 2018-2024 time period. In January 2024, the number of unique beneficiaries (i.e., the number of unique patients a personal care service agency billed for during a given timeframe) is 41x higher than the average of the other states: New York providers billed for 383,349 unique beneficiaries, compared to an average of 9,364 across all other states and DC.
Unique Beneficiaries for Code T1019: NY vs. Average All Other States + DC
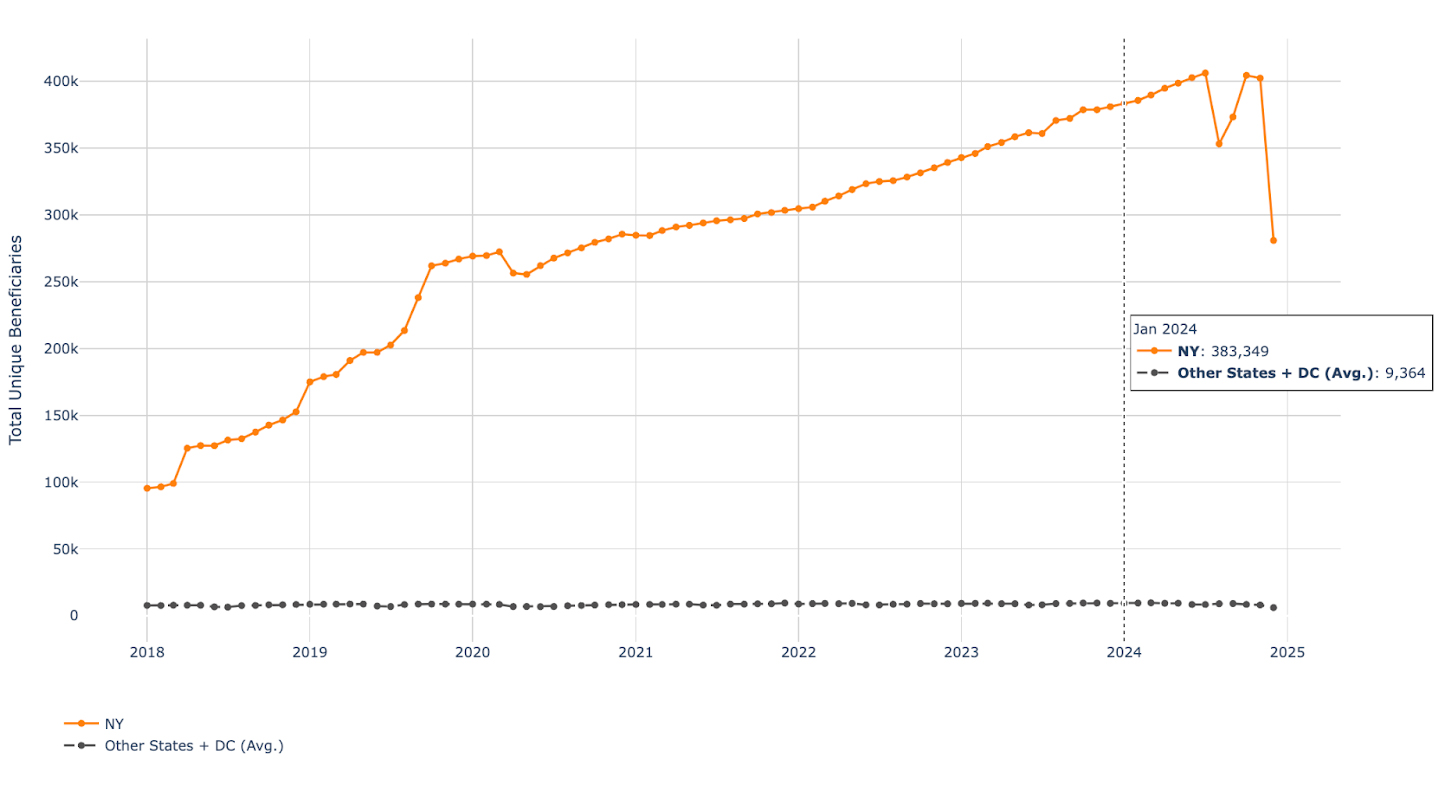
As a simple proxy, New York Medicaid and CHIP enrollment was 7.1M in January 2024, and the average enrollment across all other states was 1.6M (aggregate enrollee count across other states was 76.8M5). There are roughly 4.5x more Medicaid enrollees in NY than the average state, yet New York billed for 41x as many beneficiaries of personal care services during the same period (January 2024). Something is not adding up.
Separate analysis indicates that NY providers are also paid more per claim than the average of all other states. This is important because one common fraud pattern in high-volume services is breadth-based phantom billing, where providers submit low-dollar claims across a very large number of member IDs (“spraying” claims widely) to keep utilization per beneficiary low and avoid triggering member-level audits. If NY were experiencing that dynamic, we would expect unique beneficiaries to spike while dollars paid per claim stayed relatively modest. Instead, the fact that NY is an outlier on both dimensions, with both an implausibly large billed beneficiary population and higher reimbursement per claim, suggests a more concerning hybrid pattern: providers may be expanding the billed population through phantom activity (e.g., billing against deceased, institutionalized, or otherwise ineligible members, or outdated rosters) while also inflating reimbursement through inflated time units, inflated units per visit, or other upcoding behaviors.
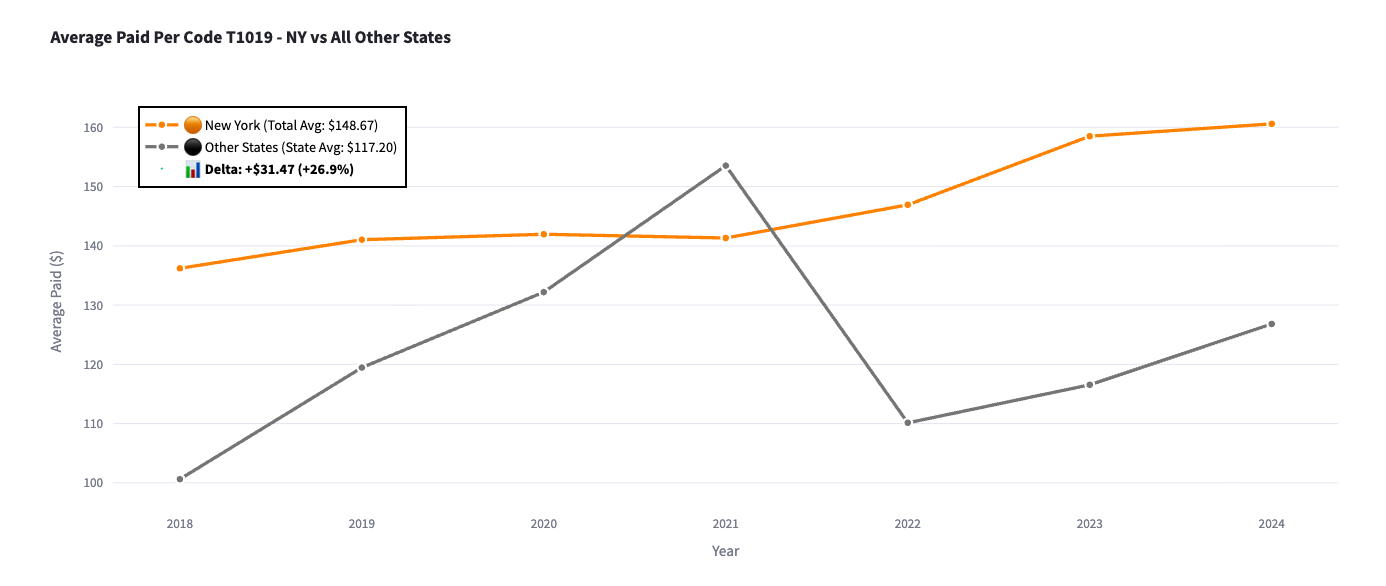
It appears that New York providers, on average, have historically been paid over 27% more than providers in other states who billed for the same T1019 procedure code. New York providers were paid $149 per procedure code, on average, while providers in other states were paid $117, on average, for the same procedure code. This could be a result of common FWA billing schemes in which aides provide 60 minutes of care to a patient but submit a claim to Medicaid that reflects 90 minutes, thereby increasing their reimbursement by 50%. Repeated inflation of billing units across hundreds of thousands of visits can lead to a substantial amount of waste and abuse that’s hard for Medicaid to identify and quantify in real time.
Average Paid Per Code T1019 - NY vs All Other States
The Compounding Math: Why Scale Makes Small Patterns Catastrophic
We’ve identified two concerning themes within the data set that could be leading to the overinflation of T1019 payments made to NY providers. Using a simple formula, we can begin to triangulate the potential scale of FWA taking place.
If you consider how much a given personal care agency is paid within a given time period under a fee-for-service model, it’s primarily a function of how many times they conduct and bill for a service, multiplied by how much they get paid each time. We can use a very simple equation: Total Reimbursement = Dollar Payment per Procedure Code x Number of Claims Billed. So in this case, let’s consider the dollar payment per procedure code. NY providers billed $149 per code on average, $32 (27%) more than all other states, who billed $117 on average.
But even more shockingly, NY providers billed the T1019 code a total of 502M times, nearly 490M more times than the average of the other states: 12M.
Number of Times Code T1019 Billed: NY vs. Average All Other States + DC

If we assume that New York billed in line with the average across both billing code dollar amount and billing code frequency, then under simplifying assumptions, an illustrative counterfactual is:

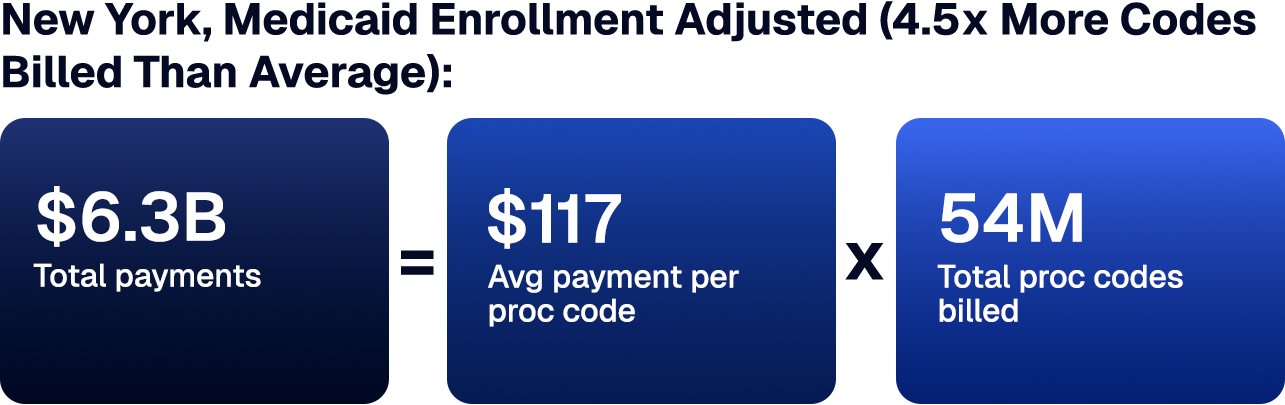
For a simple enrollment-adjusted estimate, we scaled the number of T1019 codes billed to account for New York’s Medicaid enrollee count. New York has roughly 4.5x the Medicaid enrollment of the average state, so we multiplied the benchmark utilization (total T1019 billing volume) by 4.5 to estimate what New York’s T1019 volume might look like if its utilization and billing were proportional to its enrollment size. This gives a clearer indication of the potential magnitude of Medicaid FWA taking place across the state.
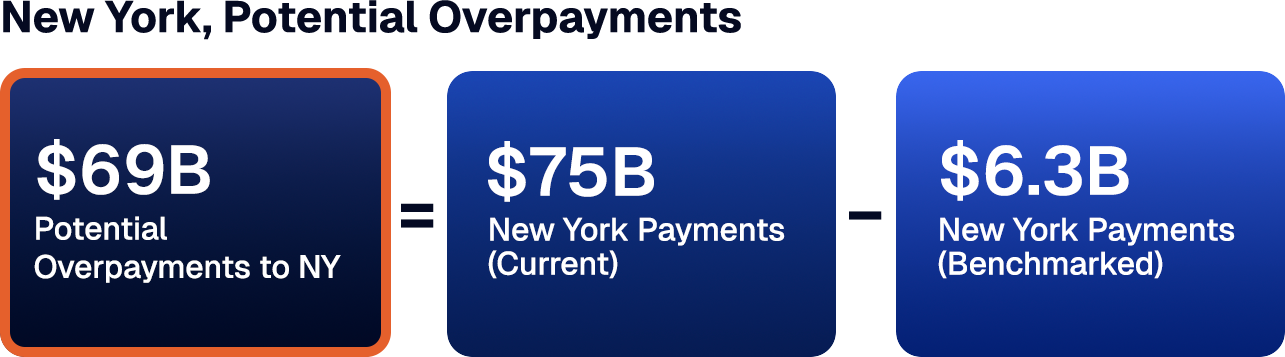
Even after adjusting the benchmark for New York’s larger Medicaid population, New York remains an extreme outlier on both T1019 billing volume and total spend, meaning this cannot be explained by Medicaid enrollment alone. Under these simplifying assumptions, the variance equates to roughly $69B in potential overpayment exposure: not a proven fraud finding, but an astonishing and deeply concerning signal that warrants targeted, provider-level investigation to determine how much is driven by program design, oversight gaps, and FWA.
Precedent in New York State
While potential FWA of this magnitude (tens of billions of dollars) may seem implausible, there is precedent that supports it.
In the FY2024-25 budget, NY Governor Kathy Hochul eliminated approximately 600 fiscal intermediaries administering the Consumer Directed Personal Assistance Program (CDPAP), citing fraud and ballooning costs in a program that had grown 4,055% since 20146. The restructuring triggered federal lawsuits7 and a $10 million lobbying campaign to reverse it8. CDPAP and T1019 share the same structural vulnerabilities: they’re both non-institutional, time-based, home-delivered, and difficult to verify, and the T1019 data findings suggest that a much larger potential issue has yet to be addressed.
The prosecutorial record makes the pattern hard to dismiss: a 2020 SDNY phantom billing indictment9, a 2023 Brooklyn conviction for $100 million in fraudulent claims10, and a 2024 EDNY indictment of eight defendants for a $68 million kickback scheme11. Each was treated as an isolated bad actor, and none triggered a systemic audit. In November 2024, State Comptroller DiNapoli conducted an audit, finding that $14.5 billion in personal care claims, 44% of all services billed in New York between 2021 and 2023, had no matching verification record12.
These cases recently prosecuted by the DOJ are not an anomaly. They are the visible edges of a much larger pattern. What we've seen in the courts versus what we see in the data begs the question of whether officials have even scratched the surface of the spending crisis that actually exists.
Closing Thoughts and Where We Go From Here
Let's be clear about what this data is showing.
New York alone billed for nearly as many T1019 unique beneficiaries as all other states combined. From 2018-2024, New York’s unique beneficiaries for code T1019 grew from approximately 100k to 400k, while all other states remained about the same. That is not a documentation anomaly; that is a billing pattern that should not be physically possible, and it has been running largely undetected for at least six years.
What makes personal care services uniquely vulnerable is their structure. T1019 is non-clinical, time-based, delivered in a private home, and billed in 15-minute increments with no real-time verification. There is no facility record. Oftentimes, there is no physician order or facility record, even though it’s required. Applied consistently across a large patient roster, that’s not a billing error: that’s a billing strategy.
The $75 billion billed in New York is not all fraudulent or even wasteful. Some portion reflects real services delivered to real people who genuinely needed them. But the beneficiary counts and per-claim payment rates point to systematic exploitation at a scale that dwarfs any individual case the DOJ has ever prosecuted. Catching it requires cross-claim, cross-methodology analysis that traditional audit infrastructure was never built to perform.
The release of federal claims data has, for the first time, made these utilization patterns visible at a national level. Whether the explanation lies in policy design, program oversight gaps, or large-scale fraud, the data suggests the need for deeper investigation. For Medicaid administrators, regulators, and health plans, the findings highlight the importance of advanced AI systems that can identify patterns and anomalies that legacy claims adjudication systems cannot. With deep expertise in claims processing, payment integrity, and medical billing FWA, the Alaffia Health team has seen these same schemes play out repeatedly in the real world, and this dataset is only the tip of the iceberg. Stay tuned for more.
This post is the first in a series examining emerging insights from the newly released HHS Medicaid claims dataset. Follow Alaffia Health for future updates.


Drive health plan affordability with Alaffia
Find out what our AI agents and managed services can do for your plan.